


ZoomPLS Function for Zooming in on Plots
What it does
The function zoompls.m adds a collection of push buttons to the current plot that can be used to zoom in on specific regions of the plot. When zoompls is executed at the command line, the push buttons appear in the lower right corner, as shown in the figure below. Here the figure was created using the pltscrs function from the PLS_Toolbox, then zoompls was executed. Clicking the + button turns the cursor into cross hairs which can be used to select opposite corners of a region of the plot. The - button changes the axes sequentially back through previous settings. The 0 button moves the axes back to automatic settings and the X removes the buttons from the figure.
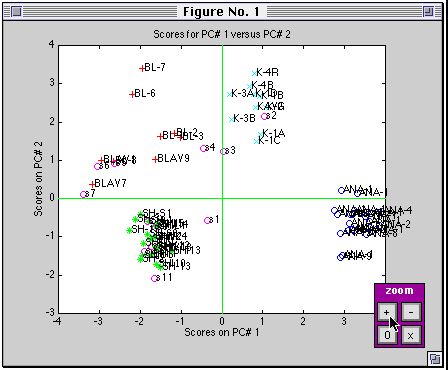
Example of zoompls push buttons added to Figure Window.
Requirements for running corrmap
- MATLAB 5.0
- No other toolboxes required
Developed by:
Neal B. Gallagher
Eigenvector Research, Inc.
nealg@eigenvector.com
Download zoompls.m
To get it, simply click on zoompls.m
for Mac, or zoompls.m for
PC. Move the file to a folder on your MATLAB path and you're
done.
Return
to MATLAB User Area.
